If you’ve been searching for a hands-on, project-based, and truly job-ready training for Power BI, Microsoft Power BI Desktop for Business Intelligence is that course. Whether you’re a total beginner or someone with a bit of data wrangling under your belt, this course breaks down the complexities of Power BI and delivers them in a way that just clicks. Let’s take a deep dive into why this course by Chris Dutton and the Maven Analytics team is one of the top-rated BI courses on Udemy.
Instructor Reputation
When it comes to learning a powerful tool like Power BI, the quality of the instruction makes all the difference—and that’s where Chris Dutton and the Maven Analytics team really set themselves apart. Chris isn’t just a popular instructor on Udemy; he’s an industry-recognized educator with deep roots in analytics, a strong technical background, and a rare gift for teaching in a way that actually sticks. With over 1.4 million students, 421,000+ reviews, and a 4.6-star instructor rating, his track record speaks for itself.

What makes Chris and Maven Analytics truly exceptional is their pedagogical approach. They don’t throw buzzwords at you or rush through dashboards like it’s a race. Instead, they walk you through complex concepts like DAX formulas, data modeling, and visualization best practices in a way that’s intuitive, clear, and—dare I say—enjoyable.
But it’s not just about theory or tools. Chris’s background as a professional Power BI developer and founder of Maven Analytics adds real-world depth to every lesson. You can tell that he’s seen these challenges firsthand and isn’t just reading from a script. His teaching is filled with real examples, nuanced commentary, and those small but impactful “pro tips” that only come from experience.
The Maven Analytics team adds even more value. They’re known in the data community not just for teaching, but for shaping careers. Their Guided Learning model and practical, skills-first methodology are built to prepare students for real data jobs—not just to pass a quiz or play around with sample files.
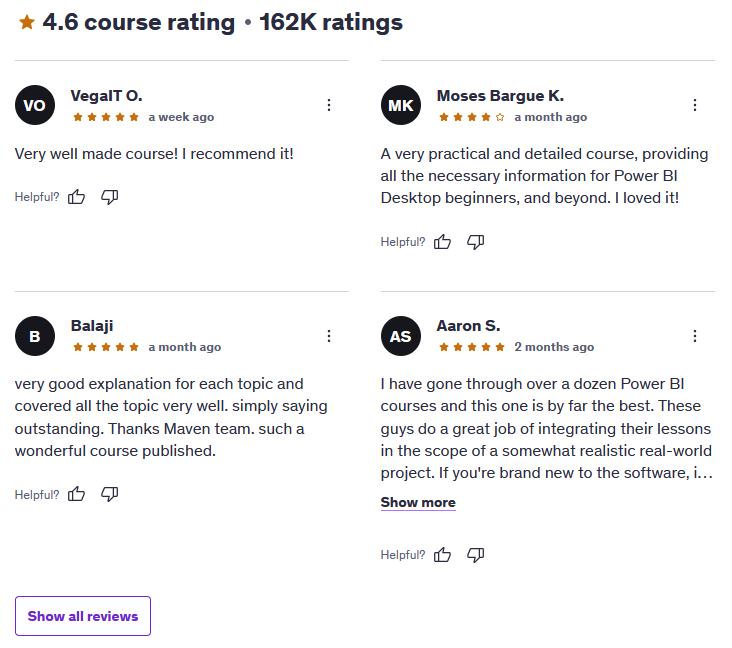
Student testimonials echo this sentiment over and over again. Many mention how this course provided more clarity than expensive in-person bootcamps, while others say it gave them the confidence to apply Power BI at work immediately. For a self-paced online course, that’s pretty rare—and a major reason this course continues to dominate Udemy’s rankings year after year.
If instructor trustworthiness, real-world experience, and teaching clarity are important to you (and they should be), this course easily checks all the boxes.
Course Structure
The structure of Microsoft Power BI Desktop for Business Intelligence is one of the standout elements of the course—and for good reason. It’s built around a logical, real-world workflow that mirrors the actual business intelligence process you’d encounter in a data-driven role. No fluff, no filler—just a thoughtfully constructed path from beginner to advanced, packed with context-rich instruction and guided practice.

Let’s break it down.
STAGE 1: Connecting & Shaping Data (Power Query)
This first phase is all about data preparation, arguably the most important (and often overlooked) part of working with Power BI. You’ll learn how to extract raw data from various sources—including Excel files, databases, and even web-based data—and shape it into something usable.
The course teaches you how to clean, transform, and organize datasets using Power Query. You’ll cover:
- Data connectors & import modes
- Table transformations (pivot/unpivot, grouping, aggregating)
- Working with text, numerical, and date/time fields
- Conditional columns, merging, appending, and rolling calendars
These skills form the foundation of everything that comes next—and they’re taught in a way that makes even beginners feel in control.
STAGE 2: Data Modeling & Relationships
Once your data is prepped, it’s time to model it—and this is where many self-learners hit a wall. But Chris explains data modeling best practices so well that even complex topics like relationship cardinality, normalization, and filter flow become digestible.
Key concepts include:
- Star vs. snowflake schemas
- Primary and foreign keys
- Fact and dimension tables
- Filter context & bidirectional relationships
This section transforms your dataset into a well-structured relational model ready for analysis—and builds your understanding of how Power BI handles data internally.
STAGE 3: DAX Formulas & Calculated Fields
Here’s where things get powerful—and a bit brainy. DAX (Data Analysis Expressions) is one of the most intimidating parts of Power BI for newcomers, but this course nails the explanation. Chris introduces you to both calculated columns and measures, while building up your confidence with filter functions, iterator patterns, and time intelligence techniques.
Topics include:
- Syntax & logic structure
- Math, statistical, and logical functions
- Advanced formulas like CALCULATE, ALL, SWITCH
- Filtering techniques & custom measures
- Common errors and how to troubleshoot them
There’s even a subtle but effective progression in difficulty so you never feel overwhelmed.
STAGE 4: Data Visualization & Dashboard Design
This is the showstopper section—where your data comes to life. You’ll learn how to build interactive dashboards that look polished and professional. From card visuals to line charts, slicers, maps, drilldowns, and navigation panels—this section is a masterclass in turning insights into stories.
Notable features:
- Design framework & best practices
- Conditional formatting & Top-N filtering
- Custom tooltips, bookmarks, parameters
- Mobile layout optimization
- Publishing to Power BI Service
You’ll also explore newer AI-driven features like decomposition trees, key influencers, smart narratives, and natural language Q&A, giving you an edge in modern BI environments.
Beyond the core curriculum, the course includes:
- 16+ hours of high-quality video
- A 200+ page companion eBook
- 25+ homework assignments with solutions
- Downloadable project files
- Lifetime access + ongoing updates
This isn’t just a course—it’s practically a full certification path wrapped in one neat package.
Content Quality
If there’s one area where Microsoft Power BI Desktop for Business Intelligence goes above and beyond, it’s content quality. This course doesn’t just skim the surface with general tips or “copy-paste” tutorials—it dives deep into the entire Power BI lifecycle with an unmatched level of polish and practicality.
The production quality of the video lessons is top-tier. Every module is well-paced, clearly narrated, and visually intuitive. Chris Dutton’s screen demonstrations are precise and fluid, with helpful visual cues that guide you step-by-step. There’s no confusion about where to click or what’s going on—even in more advanced topics like DAX calculations and relationship filters. The clarity of delivery is consistent from start to finish.
What’s especially impressive is how the course builds up your understanding organically. You start with raw, messy data and by the end of it, you’re publishing clean, professional dashboards with interactive filters, smart narratives, and sleek visuals. It’s the kind of transformation that makes you feel like a BI wizard, and that’s not an exaggeration.
Another strength lies in how well the course balances theory and hands-on practice. You’re not just absorbing content passively—you’re working through challenges, exercises, and two full-scale real-world projects. The AdventureWorks Cycles case study is a fantastic narrative thread that ties the entire curriculum together. It mimics the kind of work you’d do in a real job: analyzing KPIs, comparing regional performance, identifying high-value customers, and building dashboards from scratch.
And let’s not forget the extras:
- A 200+ page downloadable eBook for offline reference
- 25+ practical assignments with detailed solutions
- Lifetime access to all updates, including brand-new Power BI features
- AI-focused lessons on tools like decomposition trees, key influencers, and natural language Q&A
- Integration of performance optimization tips to ensure your dashboards don’t lag at scale
The content is also frequently updated, keeping up with Microsoft’s ever-evolving Power BI platform. That’s a huge plus, especially in a world where software features change rapidly.
Whether you’re a total beginner or someone with some Excel/DAX background, the material scales with you. Beginners will find the pacing manageable and the visuals helpful. More advanced users will appreciate the deep dives into complex topics like iterator functions, bi-directional filtering, and building a star schema from scratch.
Bottom line: the content is dense, but not overwhelming. It’s polished, but practical. And most importantly, it’s structured to make you actually good at Power BI—not just look like it.
Overall Course Rating – 9.5/10
If we’re putting a number on it, the Microsoft Power BI Desktop for Business Intelligence course easily earns a 9.5 out of 10—and that’s not just hype. Within the first hour of content, it’s clear that this is not your average Udemy course. It’s a professionally built, fully-featured learning experience designed to take you from absolute beginner to confident Power BI user.

The first thing that hits you is the confidence of the teaching. Chris Dutton knows the material inside and out—and better yet, he knows how to teach it. His ability to turn complex topics into “aha!” moments is a rare skill, and it’s what sets this course apart. You’re never left wondering why something is done a certain way—he explains the how and why in equal measure.
Then there’s the structure. The four-stage layout (data prep, modeling, DAX, and dashboards) mirrors the real-world BI workflow. You’re not learning features in isolation—you’re learning how to use them in context, which is exactly what employers are looking for.
And speaking of jobs, this course feels tailor-made for career readiness. You’re building dashboards that could go straight into a business portfolio. You’re solving realistic problems. You’re using real-world data. This isn’t just “playing around with a tool”—this is building job-ready skills.
Where could it improve? Well, Mac users are unfortunately left out—Power BI Desktop still isn’t supported on macOS. Also, while the DAX section is beautifully explained, beginners might need to rewatch some parts to fully grasp the concepts. But honestly, that’s more a limitation of DAX itself than the course.
What really seals the deal, though, is the value. For the price of a dinner out, you’re getting:
- 16+ hours of expertly crafted instruction
- Lifetime access with updates
- Guided projects
- Practical assignments
- A built-in support community
- And instruction that rivals corporate training sessions that cost thousands
In short, Microsoft Power BI Desktop for Business Intelligence is one of the most complete, practical, and rewarding BI courses available on Udemy. It doesn’t just help you “learn Power BI”—it helps you become someone who can use Power BI to solve real business problems, present data stories, and make decisions that matter.
If you’re serious about mastering Power BI, this course isn’t just recommended—it’s essential.